


Identifying the Right Target: The Importance of Driver Mutations in Personalized Medicine
Researchers around the world are exploring different approaches to improve our understanding of cancer. The growing need to understand the molecular mechanism of cancer genesis and progression has led to large-scale studies, like the National Institutes of Health Pan-Cancer Atlas, which is aimed at finding tissue-agnostic approaches to treating cancer. Tissue agnostic approaches where the initial genesis of cancer occurred do not impact the techniques used and are central to Cellworks biosimulation methodology.
In this article, the second in our series reviewing The Cancer Genome Atlas (TCGA) studies, we discuss the findings from three major studies that employ computational methods to classify cancers based on driver mutations, with the aim to improve cancer diagnosis, treatment, and, in turn, prognosis.
TCGA project has generated a vast volume of data about molecular (e.g. genomic, epigenomic, and gene expression) profiles of 33 cancer types. Researchers work to further refine this data to glean insights for better diagnosis, prognosis, and therapeutics.
Genes Can Determine Network Vulnerability
Cancer cells need to undergo considerable changes to enable them to adapt to the high metabolic rate required for cell proliferation. Looking in-depth at the changes that occur in metabolic pathways that lead to and support cancer progression could provide valuable insight that can be applied to the development of cancer cell metabolism targeting drugs. A study, by Peng et al., used computational methods to classify TCGA mRNA expression data of 9,125 tumor samples across 33 cancer types according to the relative activity levels of 7 major metabolic pathways.
The study identified genes that could determine network vulnerability: 348 genes were assigned to amino acid metabolism, 110 genes to the integration of energy, 286 genes to carbohydrate metabolism, 766 genes to lipid metabolism, 90 genes to nucleotide metabolism, 148 genes to the TCA cycle, and 168 genes to vitamin and cofactor metabolism. The research team then used a two-step process to classify the 9,125 tumors into 3 metabolic subtypes:
- Upregulated
- Downregulated
- Neutral
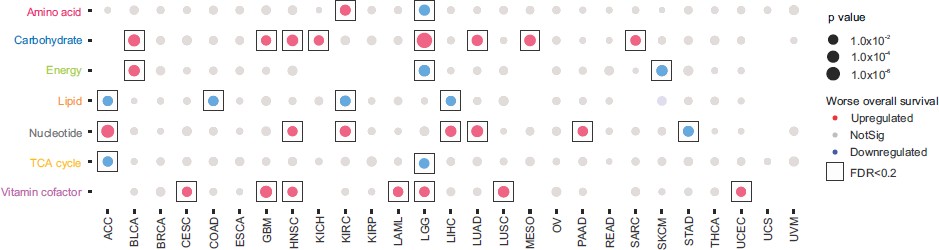
Figure 1. Classification of each tumor subtype into one of the three metabolic subtypes for each of the 7 metabolic pathways. The color indicates the correlation direction; significant correlations (log-rank test, FDR < 0.2) are boxed. Those cases without qualified subtype classifications are left blank (Ref.1).
This classification provided various insights:
- Association between expression levels of different metabolic pathways and disease prognosis.
- Correlations between metabolic expression subtypes and previously established molecular tumor subtypes.
- Demonstration of strong coupling between amino acids, nucleotides, and the TCA cycle, as shown by high correlations of their subtype assignment, similar pathway-level associations, and shared master regulators.
- Identification of potential drivers and master regulators associated with metabolic subtypes.
Metabolic Interactions Are Hallmarks of Cancer
Metabolic pathway activity was also found to be closely coupled with the major hallmark of cancer pathways, including angiogenesis, proliferation, and survival. Metabolic classification of tumors revealed novel insights into prognostic and therapeutic value. At Cellworks, our Biosimulation accounts for over half a million signaling and metabolic interactions, and all ten Weinberg’s hallmarks or phenotypes of cancer. We find that the expression/mutation status of driver genes of metabolic pathways determines disease severity as well as therapy that will be efficacious in controlling the disease. Efficacy is measured by the extent of the impact that a drug has on the phenotype.
In the next study, J. Ricketts et al carried out molecular subtyping of renal cell carcinoma (RCC) which revealed valuable therapeutic insights. Renal cell carcinoma (RCC) is recognized to be a disease made up of different subtypes of renal cancer - Clear cell renal cell carcinoma (ccRCC), papillary renal cell carcinoma (PRCC) with foursubgroups (type 1, type 2, unclassified PRCC, CpG island methylator phenotype-associated (CIMP)-RCC) and chromophobe renal cell carcinoma (ChRCC)). A deeper, molecular-level understanding is the need of the hour. Ricketts et al. used TCGA data from 843 histologically confirmed RCC samples in their study. Chromosomal copy number profiles, mRNA, miRNA, and lncRNA expression profiles of these tumor samples were compared and superimposed with survival and histological data.
They identified certain shared molecular features within the RCC subtypes that may provide more universal prognostic markers and targets for therapy. For example, the loss of CDKN2A, which encodes p16, correlated with poor survival in ccRCC, PRCC, and ChRCC. Hence, all of these cancers can be targeted with CDK4/6 inhibitors that target the downstream effects of p16 loss.
Additionally, the evaluation of metabolic states demonstrated subtype-specific metabolic profiles. For example, high ribose metabolism gene expression was present in both ccRCC and CIMP-RCC and correlated with poor survival in these subtypes.
Identification of Driver Genes is Crucial
In a third study, Bailey et al. made a systematic effort to characterize driver genes and mutations across 9423 tumor samples of 33 cancer types by combining and optimizing 26 computational tools ( PanSoftware analysis). Driver genes are one of the most critical targets to be considered for cancer treatment. Therefore, the identification of driver genes and mutations for each histological cancer subtype is crucial for precision oncology.
Among other tools, they used three-dimensional structure-based approaches to infer the effect of mutation. Such structure-based approaches were more specific than sequence-based approaches at predicting driver mutations, but with reduced sensitivity (not able to detect all driver mutations).
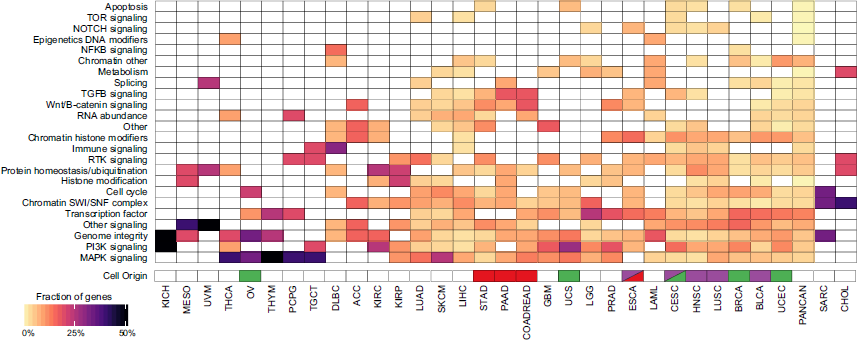
Figure 2. Heatmap from Bailey. et.al’s study shows the clustering of different cancer types by pathway/biological process affected by associated consensus driver genes. Cells of origin for pan-gastrointestinal (red), pan-squamous (purple), and pan-gynecological tissues (green) are colored (Ref.3).
Researchers discovered 299 cancer-driver genes by limiting the focus on point mutations and small indels and excluding copy-number variations, genomic fusions, or methylation events. These genes are classified according to their relation to cancer-associated processes and signaling pathways that helped to infer how various cellular processes/pathways are affected in each cancer subtype (Figure 2). 59 of these are novel genes or known drivers not previously associated with a given tissue. The number of detected driver genes varied among cancer types from 2 (kidney chromophobe (KICH)) to 55 (UCEC). Among driver genes, 142 out of 258 were associated with a single cancer. As should be expected, TP53 has been associated with the most cancer types (27), followed by PIK3CA, KRAS, PTEN, and ARID1A (each of them >15). Finally, they predict that more than half of the tumors bear clinically relevant mutations.
Using Molecular Data to Biosimulate Drug Efficacy
At Cellworks, we recognize that each cancer type has its specific set of driver mutations. Some drivers are common to more than one cancer type, while some are unique. Therefore, we can infer that using drugs that target these specific mutations would lead to effective treatment. However, cancers are not driven solely by known drivers, and we find that refractory cancers have more drivers, most of which are not common or unknown. Although identifying driver mutations in any cancer type is of great importance, therapy should not be limited solely to what is known. This is where the power of biosimulation comes in, allowing the user to understand the impact of each mutation on the disease, often providing non-obvious therapy recommendations.
All three studies utilized algorithmic tools to discover the potentially vulnerable points in existing cancer subtypes. Matching these data with survival curves allows us to determine prognosis by examining the molecular profile of a tumor.
Cellworks utilizes the molecular data of the patient’s tumor to model and biosimulate the effectiveness of each drug. Biosimulation helps us to establish the connection between a drug’s efficacy network and a patient’s mutational network, the overlap of which points to successful treatment outcomes. This enables us to choose the treatment with the best therapeutic potential among the available ones.